Visualising ECG signals
ECGprocess can generate canonical ECG images based on supplied tabular data. This is of course relevant for visualisation of individual ECGs but primarily devised to allow for image analysis on ECG data.
[1]:
# imports and test data
from ecgprocess.constants import ProcessDicomNames as PDNames
from ecgprocess.errors import NotCalledError
from ecgprocess.process_dicoms import (
    ECGDICOMReader,
)
import ecgprocess.plot_ecgs as plt_ecg
from ecgprocess.plot_ecgs import (
    ECGDrawing,
)
from ecgprocess.example_data.examples import (
    list_data_paths,
)
import matplotlib.pylab as plt

# test data
dicom_file_path = list_data_paths()['example_dicom_2']
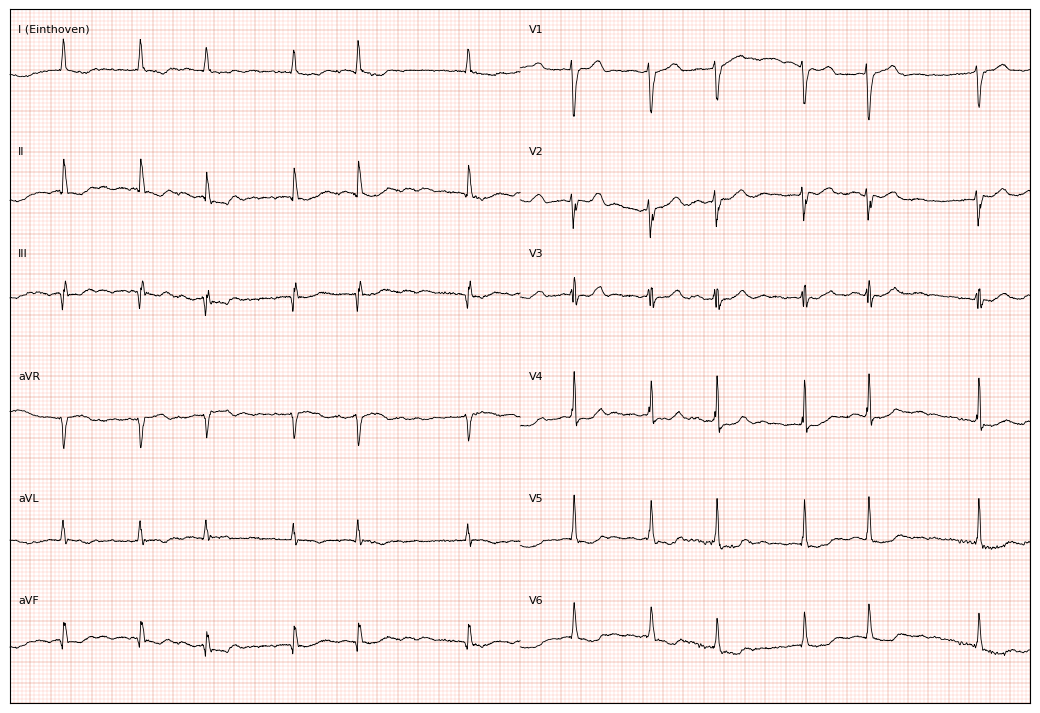
Canonical ECG image
Let’s create a traditional ECG image using an ECGReader instance.
[2]:
# process the tabular data
ecgdicomreader = ECGDICOMReader()
ecgreader=ecgdicomreader(path=dicom_file_path)

# how should the leads be presented
layout = [
    ['I (Einthoven)', 'V1'],
    ['II', 'V2'],
    ['III', 'V3'],
    ['aVR', 'V4'],
    ['aVL', 'V5'],
    ['aVF', 'V6'],
]
# draw
artist = ECGDrawing()(ecgreader, add_grid=True, minor_axis=True,
                     image_layout=layout)
Map image to numpy array
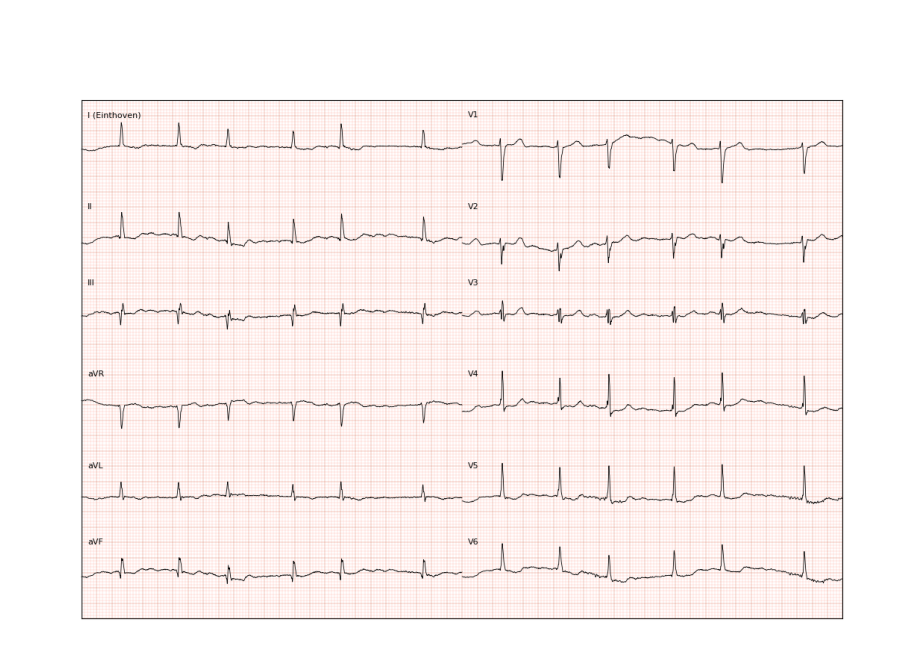
We can map the matplotlib image to a 3 dimmensional numpy array, which of course can be used to re-plot the original image.
[3]:
arr=artist.to_numpy(crop=False)
arr.shape
[3]:
(857, 1212, 4)
[4]:
fig, ax = plt.subplots()
ax.set_xlabel('')
ax.set_ylabel('')
ax.set_xticks([])
ax.set_yticks([])
plt.axis('off')

# plot and re-size
ax.imshow(arr)
fig.set_size_inches(11.70, 8.30)
Median beats
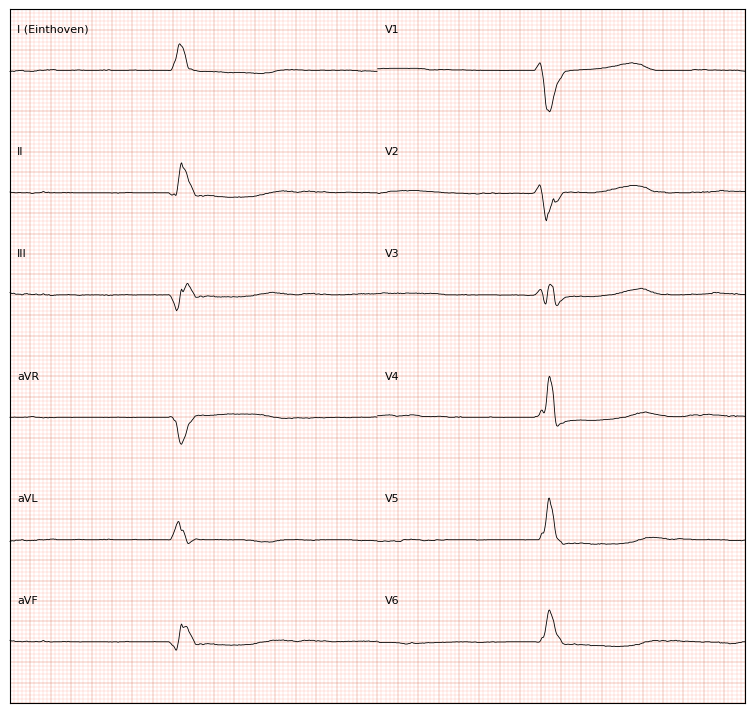
The median beats can be drawn as well.
[5]:
artist.width=180
artist.text_pad_x=10
artist = artist(ecgreader, add_grid=True, minor_axis=True,
                     image_layout=layout, wave_type='median')
[6]:
help(plt_ecg)
Help on module ecgprocess.plot_ecgs in ecgprocess:

NAME
    ecgprocess.plot_ecgs - Tools to plot ECG signals.

DESCRIPTION
    The primary aim is not to make nice ECG visuals but to create input data for
    image analysis.

    The code heavily borrows from the following brilliant github
    `repository <https://github.com/marcodebe/dicom-ecg-plot>`_.

CLASSES
    builtins.object
        ECGDrawing

    class ECGDrawing(builtins.object)
     |  ECGDrawing(update_keys: dict[str, str] | None = None) -> None
     |
     |  Takes a called `ECGDICOMReader` instance and plots the lead-specific
     |  ECG signals. Includes a method to map the figure to a 3-dimensional numpy
     |  array.
     |
     |  Attributes
     |  ----------
     |  mm_mv : `float`, default 10
     |      The scaling factor applied to the ECG signals, mapping these from
     |      1mm/mV to mm_vv * mm/mv.
     |  paper_w : `float`, default 297 mm
     |      The figure width.
     |  paper_h : `float`
     |      The figure height, default 210 mm
     |  width : `float`
     |      The plotting area width, default 250 mm
     |  height : `float`
     |      The plotting area height, default 170 mm
     |  grid_color : `dict` {`minor`: colour_1, `major`: color_2}
     |      The grid line colours.
     |  grid_linewidth : `dict`
     |      The grid line width.
     |  text_pad_x : `float`, default 40
     |      Padding of the text x-axis coordinate.
     |
     |  Methods
     |  -------
     |  to_numpy(crop)
     |      maps a matplotlib image to a numpy array.
     |
     |  Notes
     |  -----
     |  Calling the class instance will check the ECG unit, and if needed convert
     |  microvolts (µV) to millivolts (mV).
     |
     |  Methods defined here:
     |
     |  __call__(self, ecgreader: Callable, wave_type: Literal['rhythm', 'median'] = 'rhythm', start_pos: Literal['first', 'continues'] = 'first', add_grid: bool = False, minor_axis: bool = True, image_layout: list[list[str]] | None = None, auto_margins: bool = True, verbose: bool = True, ax: matplotlib.axes._axes.Axes | None = None) -> Self
     |      Creates an ECG drawing using either the waveforms `rhythm` or the median
     |      beats signals.
     |
     |      Parameters
     |      ----------
     |      ecgreader : Callable
     |          An instance of the `ECGDICOMReader`, or a similar, data class that
     |          has already been called to process the ECG data.
     |      wave_type : {'rhythm', 'median'}, default `rhythm`
     |          The type of ECG signal to plot.
     |      start_pos: {`first`, `continues`}, default `first`
     |          Whether multiple sequential leads should start at the first
     |          time point, or whether the next lead should start at the time
     |          the previous lead stopped.
     |      add_grid : `bool`, default `False`
     |          Whether to annotate the ECG image with a canonical grid (with small
     |          squares indicating 0.04 seconds (x-axis) and 0.1 mV (y-axis) and
     |          the larger squares a 5 multiple. Depending on the intended
     |          deployment setting and the applied pre-processing you may want to
     |          remove the grid.
     |      minor_axis: `bool`, default `True`
     |          Whether to add the minor grid axes.
     |      image_layout : `list` [`list` [`str`]]
     |          A nested lists organising the image by ECG lead names. When
     |          wave_type is `median` please ensure the supplied list has the same
     |          number of columns in each row.
     |      ax : plt.Axes, default `NoneType`
     |          An optional `matplotlib.axes.Axes` instance on which the ECG
     |          signals are plotted. If ommited will simply take an A4 x/y axes
     |          aspect ratio and mimic a cononical ECG image.
     |          canonical ECG image (using an A4 size y and x-axis aspect ratio).
     |      verbose : `bool`, default `False`
     |          Prints missing files if skip_missing is set to `True`.
     |
     |      Attributes
     |      ----------
     |      ecg_signal : `dict` [`str`, `np.ndarray`]
     |          The ECG signals depicted in the figure. Organised as a dictionary
     |          with keys matching the lead name and np.ndarray as values recording
     |          the ECG measurement.
     |      ecg_unit : `str`
     |          The measurement unit - should be `millivolt`. Included here for
     |          checking/debugging.
     |      image_layout : `list` [`list` [`str`]]
     |          A nested lists organising the image by ECG lead names.
     |      wave_type : `str`
     |          The type of ECG signal.
     |      fig : `plt.figure`
     |          The matplotlib figure.
     |      ax : `plt.axes`
     |          The matplotlib axes.
     |
     |      Returns
     |      -------
     |      self : `ECGDICOMDraw` instance
     |          Returns the class instance with updated attributes.
     |
     |      Notes
     |      -----
     |      To replicate an actual ECG image the signals are plotted on a single
     |      x-axis. When plotting waveforms (i.e. wave_type=`rhythm`) which are
     |      periodic the x-axis is simply divided in equally spaced sections and
     |      the ECG signals are sampled based on the x-axis coordinates which
     |      match the specific section. Median beats are not periodic and hence
     |      the class simply plots the entire signal. This does mean that the
     |      image_layout should have the same number of elements/columns for each
     |      row.
     |
     |      Example
     |      -------
     |      >>> layout = [
     |      >>>     ['I', 'aVR', 'V1', 'V4'],
     |      >>>     ['II', 'aVL', 'V2', 'V5'],
     |      >>>     ['III', 'aVF', 'V3', 'V6'],
     |      >>> ]
     |      >>> ecgdicomreader = ECGDICOMReader()
     |      >>> ecgdicomreader = ecgdicomreader(path=path, skip_empty=skip_empty,
     |      >>>                                verbose=verbose)
     |      >>> plt.ion()
     |      >>> artist = ECGDrawing(add_grid=True, image_layout=layout)
     |      >>> plt.close()
     |
     |  __init__(self, update_keys: dict[str, str] | None = None) -> None
     |      Initialises a new instance of `ECGDrawing`.
     |
     |      Parameters
     |      ----------
     |      update_keys: dict [`str`, `str`], default `NoneType`
     |          A dictionary to remap lead names: [`old`, `new`]
     |
     |  __repr__(self)
     |      Return repr(self).
     |
     |  __str__(self)
     |      Return str(self).
     |
     |  to_numpy(self, crop: bool = False, close: bool = True) -> numpy.ndarray
     |      Maps a matplotlib image to a numpy array.
     |
     |      Parameters
     |      ----------
     |      crop : `bool`, default `False`
     |          Whether the image should be cropped to focus on the data within
     |          the axes spines. False simply maps the entire figure object to a
     |          numpy array.
     |      close : `bool`, default `True`
     |          Whether to call `plt.close` after extracting the numpy array data.
     |
     |      Returns
     |      -------
     |      array : np.ndarray
     |          3-dimensional array:
     |              x: the pixels along the vertical axis.
     |              y: the pixels along the horizontal axis.
     |              z: the number of channels (4 for an RGBA image).
     |
     |      Notes
     |      -----
     |      Crop does not really crop the image it simply increases the axes to
     |      cover the entire figure and resizes the figure to the original axes
     |      size.
     |
     |  ----------------------------------------------------------------------
     |  Data descriptors defined here:
     |
     |  __dict__
     |      dictionary for instance variables
     |
     |  __weakref__
     |      list of weak references to the object

DATA
    Callable = typing.Callable
        Deprecated alias to collections.abc.Callable.

        Callable[[int], str] signifies a function that takes a single
        parameter of type int and returns a str.

        The subscription syntax must always be used with exactly two
        values: the argument list and the return type.
        The argument list must be a list of types, a ParamSpec,
        Concatenate or ellipsis. The return type must be a single type.

        There is no syntax to indicate optional or keyword arguments;
        such function types are rarely used as callback types.

    Dict = typing.Dict
        A generic version of dict.

    List = typing.List
        A generic version of list.

    Literal = typing.Literal
        Special typing form to define literal types (a.k.a. value types).

        This form can be used to indicate to type checkers that the corresponding
        variable or function parameter has a value equivalent to the provided
        literal (or one of several literals)::

            def validate_simple(data: Any) -> Literal[True]:  # always returns True
                ...

            MODE = Literal['r', 'rb', 'w', 'wb']
            def open_helper(file: str, mode: MODE) -> str:
                ...

            open_helper('/some/path', 'r')  # Passes type check
            open_helper('/other/path', 'typo')  # Error in type checker

        Literal[...] cannot be subclassed. At runtime, an arbitrary value
        is allowed as type argument to Literal[...], but type checkers may
        impose restrictions.

    Optional = typing.Optional
        Optional[X] is equivalent to Union[X, None].

    Self = typing.Self
        Used to spell the type of "self" in classes.

        Example::

            from typing import Self

            class Foo:
                def return_self(self) -> Self:
                    ...
                    return self

        This is especially useful for:
            - classmethods that are used as alternative constructors
            - annotating an `__enter__` method which returns self

    Tuple = typing.Tuple
        Deprecated alias to builtins.tuple.

        Tuple[X, Y] is the cross-product type of X and Y.

        Example: Tuple[T1, T2] is a tuple of two elements corresponding
        to type variables T1 and T2.  Tuple[int, float, str] is a tuple
        of an int, a float and a string.

        To specify a variable-length tuple of homogeneous type, use Tuple[T, ...].

    Type = typing.Type
        Deprecated alias to builtins.type.

        builtins.type or typing.Type can be used to annotate class objects.
        For example, suppose we have the following classes::

            class User: ...  # Abstract base for User classes
            class BasicUser(User): ...
            class ProUser(User): ...
            class TeamUser(User): ...

        And a function that takes a class argument that's a subclass of
        User and returns an instance of the corresponding class::

            def new_user[U](user_class: Type[U]) -> U:
                user = user_class()
                # (Here we could write the user object to a database)
                return user

            joe = new_user(BasicUser)

        At this point the type checker knows that joe has type BasicUser.

    Union = typing.Union
        Union type; Union[X, Y] means either X or Y.

        On Python 3.10 and higher, the | operator
        can also be used to denote unions;
        X | Y means the same thing to the type checker as Union[X, Y].

        To define a union, use e.g. Union[int, str]. Details:
        - The arguments must be types and there must be at least one.
        - None as an argument is a special case and is replaced by
          type(None).
        - Unions of unions are flattened, e.g.::

            assert Union[Union[int, str], float] == Union[int, str, float]

        - Unions of a single argument vanish, e.g.::

            assert Union[int] == int  # The constructor actually returns int

        - Redundant arguments are skipped, e.g.::

            assert Union[int, str, int] == Union[int, str]

        - When comparing unions, the argument order is ignored, e.g.::

            assert Union[int, str] == Union[str, int]

        - You cannot subclass or instantiate a union.
        - You can use Optional[X] as a shorthand for Union[X, None].

FILE
    /home/amand/google_drive/Research/ECGProcess/ecgprocess/plot_ecgs.py